Congressional Budget Office—
In 2016, the federal budget deficit will increase, in relation to the size of the economy, for the first time since 2009, according to the Congressional Budget Office’s estimates. If current laws generally remained unchanged, the deficit would grow over the next 10 years, and by 2026 it would be considerably larger than its average over the past 50 years, CBO projects. Debt held by the public would also grow significantly from its already high level.
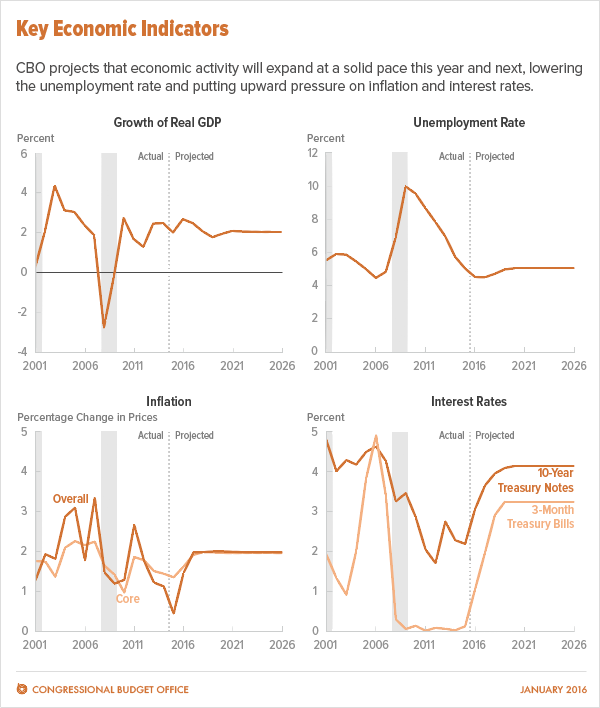
CBO anticipates that the economy will expand solidly this year and next. Increases in demand for goods and services are expected to reduce the quantity of underused labor and capital, or “slack,” in the economy—thereby encouraging greater participation in the labor force by reducing the unemployment rate and pushing up compensation. That reduction in slack will also push up inflation and interest rates. Over the following years, CBO projects, output will grow at a more modest pace, constrained by relatively slow growth in the nation’s supply of labor. Nevertheless, in those later years, output is anticipated to grow more quickly than it has during the past decade.
The Budget Deficit for 2016 Will Increase After Six Years of Decline
The 2016 deficit will be $544 billion, CBO estimates, $105 billion more than the deficit recorded last year (see Summary Table 1). At 2.9 percent of gross domestic product (GDP), the expected shortfall for 2016 will mark the first time that the deficit has risen in relation to the size of the economy since peaking at 9.8 percent in 2009. About $43 billion of this year’s increase in the deficit results from a shift in the timing of some payments that the government would ordinarily have made in fiscal year 2017, but that will instead be made in fiscal year 2016, because October 1, 2016—the first day of fiscal year 2017—falls on a weekend. If not for that shift, the projected deficit in 2016 would be $500 billion, or 2.7 percent of GDP.
The 2016 deficit that CBO currently projects is $130 billion higher than the one that the agency projected in August 2015. That increase is largely attributable to legislation enacted since August—in particular, the retroactive extension of a number of provisions that reduce corporate and individual income taxes.
The deficit projected by CBO would increase debt held by the public to 76 percent of GDP by the end of 2016, the agency estimates—about 2 percentage points higher than it was last year and higher than it has been since the years immediately following World War II (see figure below).

Outlays
Federal outlays are projected to rise by 6 percent this year—to $3.9 trillion, or 21.2 percent of GDP. That increase is the result of a nearly 7 percent rise in mandatory spending, a 3 percent increase in discretionary outlays (which stem from annual appropriations), and a 14 percent jump in net interest spending.
CBO anticipates that mandatory outlays will be $168 billion higher in 2016 than they were last year. A significant component of that growth is Social Security outlays, which are expected to increase by about $28 billion (or 3 percent)—a percentage increase that is smaller than last year’s, primarily because beneficiaries did not receive a cost-of-living adjustment in 2016 but did receive one in 2015. Nevertheless, because the program is so large, even that smaller-than-average increase accounts for one-sixth of the growth in mandatory spending projected for 2016. Federal spending for the major health care programs accounts for a much larger fraction—more than 60 percent—of the projected growth in mandatory spending: Outlays for Medicare (net of premiums and other offsetting receipts), Medicaid, and the Children’s Health Insurance Program, plus subsidies for health insurance purchased through exchanges and related spending, are expected to be $104 billion (or 11 percent) higher this year than they were in 2015.
Discretionary outlays are projected to be $32 billion higher in 2016 than they were last year. That upturn results largely from the Bipartisan Budget Act of 2015 (Public Law 114-74), which increased statutory limits on discretionary funding, and from the resulting appropriations for 2016, which were equal to those limits. According to CBO’s estimates, discretionary outlays for national defense—in their first increase in five years—will edge up slightly this year, and nondefense discretionary outlays will climb by 4 percent.
The substantial increase that CBO expects in net interest spending, $32 billion, results from two factors: Interest rates are beginning to rise, and federal debt is growing. But interest rates remain quite low by historical standards, so net interest spending is anticipated to equal only 1.4 percent of GDP in 2016, still well below its 50-year average of 2.0 percent.
Revenues
CBO expects federal revenues to rise by 4 percent in 2016—to $3.4 trillion, or 18.3 percent of GDP. That overall increase results from growth in some sources of revenues and declines in others. Revenues from individual income taxes are projected to rise by 5 percent—more than the percentage increase in nominal GDP—because people’s nominal income will increase and also because their income will rise more than will the tax brackets, which are indexed only to inflation. That phenomenon, real bracket creep, occurs in most years when the economy expands. Economic growth also will contribute to a rise of 3 percent in payroll taxes, CBO estimates. In contrast, corporate income taxes are projected to dip by 5 percent, largely because of recent legislation (the Consolidated Appropriations Act, 2016, P.L. 114-113) that extended several expired tax provisions retroactively to the beginning of calendar year 2015. Revenues from other sources are estimated to increase, on net, by 9 percent, primarily because of recent legislation (the Fixing America’s Surface Transportation Act, also called the FAST Act, P.L. 114-94) that increases remittances to the Treasury from the Federal Reserve.
Growing Deficits Are Projected to Drive Up Debt
In CBO’s baseline projections (which incorporate the assumption that current laws will generally remain the same), growth in spending—particularly for Social Security, health care, and interest payments on federal debt—outpaces growth in revenues over the coming 10 years. The budget deficit increases modestly through 2018 but then starts to rise more sharply, reaching $1.4 trillion in 2026. As a percentage of GDP, the deficit remains at roughly 2.9 percent through 2018, starts to rise, and reaches 4.9 percent by the end of the 10-year projection period. The projected cumulative deficit between 2017 and 2026 is $9.4 trillion.
The projected deficits would push debt held by the public up to 86 percent of GDP by the end of the 10-year period, a little more than twice the average over the past five decades. Beyond the 10-year period, if current laws remained in place, the pressures that had contributed to rising deficits during the baseline period would accelerate and push debt up even more sharply. Three decades from now, for instance, debt held by the public is projected to equal 155 percent of GDP, a higher percentage than any previously recorded in the United States.
Such high and rising debt would have serious negative consequences for the budget and the nation:
- When interest rates increased from their current levels to more typical ones, federal spending on interest payments would rise substantially.
- Because federal borrowing reduces total saving in the economy over time, the nation’s capital stock would ultimately be smaller than it would be if debt was smaller, and productivity and total wages would be lower.
- Lawmakers would have less flexibility to use tax and spending policies to respond to unexpected challenges.
- The likelihood of a fiscal crisis in the United States would increase. There would be a greater risk that investors would become unwilling to finance the government’s borrowing needs unless they were compensated with very high interest rates; if that happened, interest rates on federal debt would rise suddenly and sharply.
Outlays
In CBO’s projections, federal outlays remain near 21 percent of GDP for the next few years—higher than their average of 20.2 percent over the past 50 years. Later in the coming decade, if current laws generally remained the same, growth in outlays would outstrip growth in the economy, and outlays would rise to 23 percent of GDP by 2026. That increase reflects significant growth in mandatory spending and interest payments, offset somewhat by a decline (in relation to the size of the economy) in discretionary spending.
Outlays for mandatory programs are projected to rise from their current 13.1 percent of GDP (a figure that has been adjusted for the timing shift mentioned above) to 15.0 percent by the end of the 10-year projection period. That increase is mainly attributable to the aging of the population and rising health care costs per person. (According to CBO’s projections, the number of people who are at least 65 years old will increase by 37 percent between now and 2026.) Of the 1.8 percentage-point increase in projected mandatory outlays, 0.9 percentage points come from a projected increase in Social Security outlays, and 0.8 percentage points come from a projected increase in Medicare outlays (net of premiums and other offsetting receipts). Almost half of the projected $2.5 trillion increase in total outlays from 2016 to 2026 is for Social Security and Medicare.
Because of rising interest rates and growing federal debt held by the public, the government’s interest payments on that debt are projected to rise sharply over the next 10 years—more than tripling in nominal terms and more than doubling as a percentage of GDP, from 1.4 percent to 3.0 percent. Interest rates are now very low by historical standards, so net outlays for interest (in nominal dollars) are similar to their levels 15 to 20 years ago, even though federal debt now equals a considerably larger share of the economy. As interest rates rise, the government’s cost of financing its debt will climb— especially if that debt continues to mount, as it does in CBO’s projections.
In contrast, discretionary spending is projected to drop from 6.5 percent of GDP this year to 5.2 percent in 2026, a smaller percentage than in any year since 1962 (the first year for which comparable data are available). That projection incorporates the assumptions that the limits on funding and the automatic spending reductions set by the Budget Control Act of 2011 (P.L. 112-25), as they were subsequently amended, will stay in place through 2021; that appropriations for those years will be equal to the limits; and that funding in later years will keep pace with inflation.
Revenues
If current laws generally remained unchanged, revenues would remain relatively stable in relation to the size of the economy, ranging between 17.9 percent and 18.2 percent of GDP through 2026. (They have averaged 17.4 percent of GDP over the past 50 years.)
The projected stability of revenues over the next decade stems mostly from offsetting changes in projections of revenues from various sources. In CBO’s baseline, receipts from individual income taxes increase each year in relation to GDP, because of real bracket creep, an expected increase in the share of wage and salary income going to high-income taxpayers, rising distributions from tax-deferred retirement accounts, and other factors. But revenues from other sources decline in relation to GDP. Remittances from the Federal Reserve, which have been unusually high since 2010, return to more typical levels. Corporate profits as a share of GDP decline modestly because of rising labor costs, higher interest payments on businesses’ debt, and other factors, reducing receipts from corporate income taxes. And payroll tax receipts decline slightly in relation to GDP, primarily because of the expected increase in the share of wages going to higher-income taxpayers.
Changes From CBO’s August 2015 Budget Projections
Over the 2016–2025 period (which was the 10-year projection period that CBO used last year), CBO now projects a cumulative deficit that is $1.5 trillion larger than the $7.0 trillion that the agency projected in August 2015. The $1.5 trillion increase is the net result of projected revenues that are lower by $1.2 trillion and projected outlays that are higher by $323 billion.
About half of the $1.5 trillion increase stems from the effects of laws enacted since August—which will reduce revenues by $425 billion and increase outlays by $324 billion over the 2016–2025 period, CBO estimates, adding $749 billion to projected deficits. Much of that amount stems from the extension of tax provisions by the Consolidated Appropriations Act, 2016, which will reduce corporate and individual income taxes.
About 30 percent of the increase in CBO’s projection of the cumulative deficit through 2025—$437 billion—results from revisions to CBO’s economic forecast. Lowered expectations for growth in the economy and for wages and corporate profits led the agency to reduce its projections of tax receipts from all sources by $771 billion over the 2016–2025 period. Lower projections of inflation, interest, and unemployment rates, among other changes, led CBO to mark down projected outlays by a smaller amount, $334 billion.
Finally, technical estimating changes that CBO has made since August have increased the agency’s projection of the cumulative deficit over the 2016–2025 period by $363 billion, largely by increasing projected outlays. The most significant adjustments to outlays involve Medicaid and veterans’ benefits. CBO boosted its projections of federal outlays for Medicaid to reflect higher-than-expected spending and enrollment for newly eligible beneficiaries under the Affordable Care Act. Also, on the basis of recent trends in the size of the eligible population and in average benefit payments, CBO now projects that spending for veterans’ disability compensation will increase substantially.
Solid Economic Growth Over the Next Few Years Will Reduce Slack in the Labor Market
CBO expects that the economy will grow more quickly in 2016 and 2017 than it did in 2015, when real (that is, inflation-adjusted) GDP grew by an estimated 2.0 percent. The agency anticipates moderate economic growth in subsequent years, constrained by relatively slow growth in the labor force.
The Economic Outlook for 2016 Through 2020
If current laws governing federal taxes and spending generally remained in place, by CBO’s projections, real GDP would grow by 2.7 percent this calendar year and by 2.5 percent in 2017, as measured by the change from the fourth quarter of the previous year (see figure below). From 2018 through 2020, the economy would grow at an average annual rate of 2.0 percent, CBO projects.
The agency anticipates that consumer spending will be the largest single component of that growth, as it has been in the past. However, the pickup in the growth of output from 2015 to 2016 and 2017 is likely to stem largely from faster growth in investment in business capital and housing.
Fiscal Policy and the Economy. The pattern of projected federal spending and revenues under current law would have a range of effects on the economy through 2020. Laws enacted since August—most notably the Bipartisan Budget Act of 2015 and the Consolidated Appropriations Act, 2016—are estimated to boost real GDP slightly this year and next year. In total, however, the fiscal policies embodied in CBO’s baseline would dampen GDP growth in 2017 and 2018, CBO estimates. In addition, some aspects of fiscal policy under current law, particularly the Affordable Care Act and real bracket creep, are projected to dampen the supply of labor and therefore the growth of output through 2020.
The Labor Market. Since the end of the most recent recession in 2009, GDP has grown faster than potential GDP, on average. (Potential GDP is the maximum sustainable output of the economy.) The gap between the two has therefore shrunk, reducing the amount of slack in the economy. In its current projections, CBO expects slack to diminish over the next few years; for example, the agency projects that hiring will reduce the unemployment rate from 5.0 percent in the fourth quarter of 2015 to 4.5 percent in the fourth quarter of 2016, which would be temporarily below the estimated natural rate of unemployment (the rate that arises from all sources except fluctuations in the overall demand for goods and services).
That relatively low unemployment rate would not indicate that slack in the labor market had disappeared entirely. Indeed, some slack is expected to persist through 2020, because fewer people will be participating in the labor market than if the economy was operating at its potential. However, as hiring puts upward pressure on employees’ compensation, it is also likely to encourage some people to enter or stay in the labor force, gradually reducing the shortfall between actual and potential labor force participation. (Potential labor force participation is nevertheless projected to decline as a result of underlying demographic trends and, to a smaller degree, federal policies.)
Inflation. CBO expects the economic expansion over the next two years to put upward pressure on prices, helping raise the rate of inflation to the Federal Reserve’s goal of 2 percent per year, on average, as measured by the price index for personal consumption expenditures.
Interest Rates. In CBO’s economic forecast, interest rates rise from their currently low levels. The Federal Reserve had held the target range for the federal funds rate (its primary policy rate) at zero to 0.25 percent since late 2008, but in December 2015, it raised the range to 0.25 percent to 0.5 percent. CBO projects that the federal funds rate will rise to 1.2 percent in the fourth quarter of 2016 and to 2.2 percent in the fourth quarter of 2017 before settling at 3.5 percent in the second quarter of 2019. Interest rates on federal borrowing are also expected to rise steadily over the next few years, as the economy improves and the federal funds rate rises. CBO projects that the interest rate on 3-month Treasury bills will steadily rise from 0.1 percent in the fourth quarter of 2015 and settle at 3.2 percent by the middle of 2019. CBO also projects that the interest rate on 10-year Treasury notes will rise from 2.3 percent in the fourth quarter of 2015 to 4.1 percent by the second half of 2019.
The Economic Outlook for 2021 Through 2026
CBO’s projections for the second half of the 10-year period are not based on forecasts of cyclical developments in the economy; rather, they are based on the projected trends of underlying factors, such as growth in the labor force, the number of hours worked, and productivity. According to those projections, productivity will grow faster than it did over the past decade, and both actual and potential GDP will expand at an annual average rate of 2.0 percent. That rate represents a significant slowdown from the average growth of potential output that was observed during the 1980s, 1990s, and early 2000s; the slowdown results largely from slower projected growth in the nation’s supply of labor.
Real GDP is projected to be about one-half of one percentage point lower than real potential GDP from 2021 through 2026, reflecting the historical average over the several business cycles that occurred between 1961 and 2009. Correspondingly, the projected unemployment rate over the 2021–2026 period, 5.0 percent, remains slightly above the natural rate. Inflation, as measured by the price index for personal consumption expenditures, is projected to average 2.0 percent per year, and interest rates for 3-month Treasury bills and 10-year Treasury notes are projected to average 3.2 percent and 4.1 percent, respectively. Those interest rates would be well above current rates. However, they would be lower than the average rates over the 25 years before the most recent recession, primarily because of lower inflation and slower growth in the labor force and in productivity.
Changes From CBO’s August 2015 Economic Projections
CBO’s current economic projections differ in some important respects from those that the agency made in August 2015. For example, revisions to historical data lowered CBO’s estimates of potential total factor productivity (TFP) in the nonfarm business sector through 2015. (TFP is the average real output per unit of combined labor and capital services.) Also, after reassessment, CBO concluded that the slow growth of potential TFP was likely to persist longer than the agency had projected in August. As a result, CBO has revised its projected path of potential output downward since August, an adjustment that left potential and real GDP nearly 3 percent lower at the end of the 10-year period.
In addition, economic developments since August point to a weaker outlook for output growth over the next few years. CBO also projects a lower rate of unemployment and lower interest rates than it did in August.
A Note About These Budget and Economic Projections
In mid-December 2015, after CBO had completed the economic forecast that underlies its budget projections for this report, lawmakers enacted legislation that affected certain aspects of the economic outlook. Consequently, CBO’s economic forecast has been updated to reflect the enactment of that legislation, as well as economic developments through the end of the year; that updated forecast is presented in this report. But the agency did not have enough time to incorporate those later changes to its economic forecast into its budget projections. Therefore, even though the budget projections in this report include the direct budgetary effects of legislation enacted through December, they are based on the economic forecast that CBO completed in early December.
CBO’s next set of budget projections will be issued in March. They will be based on the economic forecast completed at the end of December and will also incorporate revisions derived from information that becomes available when the President’s budget is published and from other sources.
A preliminary analysis at this point suggests that if CBO had incorporated that updated economic forecast into these budget projections, revenues in the baseline would be between $100 billion and $200 billion (or 0.2 percent to 0.4 percent) higher over the 2016–2026 period than they are currently projected to be. Projected outlays would also be affected, but probably to a lesser extent. CBO will also make technical estimating changes in its March projections that could be larger than those amounts, in either direction.
Leave A Comment
You must be logged in to post a comment.